

The S&P 500 fell 1.9% last week (total return). What’s amazing is that 10 of the 11 sectors that make up the S&P 500 outperformed the index. But the exception was technology and it underperformed by quite a bit, returning -7.2%.
Even after last week, technology is still the second-best sector year to date (after energy), more than doubling the return of the S&P 500. AI is the main theme driving markets right now and some rotation is healthy. Plus, as we discuss below, midterm years are historically the most volatile in the four-year presidential cycle, but also often lead to better things. We take another look at midterms below and then take a deeper dive into some of the latest on AI.
Here Comes the Midterm Election
Ready or not, midterm elections are coming, with Election Day on Tuesday, November 3. In fact, since early voting is already taking place, you could say they’re already here. We took an initial look at the midterm election last week, but here are some other important additional charts and things to consider.
Below we look at what history says about the likely outcome, which configurations of Washington have been best for stocks, and why the bigger picture for investors heading into year-end remains a good one.
Policy Outcomes Often Don’t Play Out as Expected
We will start with this: if you hear how a certain industry or sector will move a certain way based on the midterm results, just be skeptical. When President Trump won in 2016 we were told that he didn’t like the founder of one of the largest tech companies (and vice versa) and large cap tech would struggle. Obviously, the past decade has been all about tech, and those bearish tech calls didn’t play out very well. When President Biden won we heard that marijuana stocks would go higher and coal stocks would collapse. Well, we saw the exact opposite. Even more recently we were told that President Trump was the most pro-bitcoin president ever when he won the second time. That’s hard to argue with, but note that bitcoin is down since he was inaugurated in January 2025.
We’ll let Joseph Granville sum it up with his famous quote, “If it is obvious, it is obviously wrong.”
Don’t Shoot the Messenger
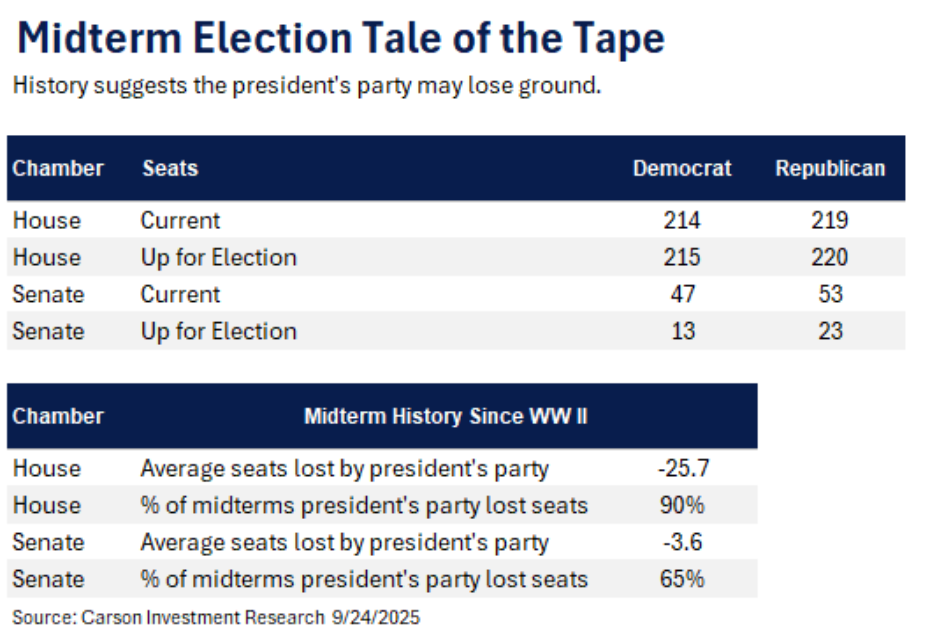
We’re just sharing the facts here. The facts are the motivated party is the party that lost the presidential election, which in this case would be the Democrats. Below is a Tale of the Tape that shows it is quite common for the party in the White House to lose 25 seats in the House and close to four in the Senate in the midterm.
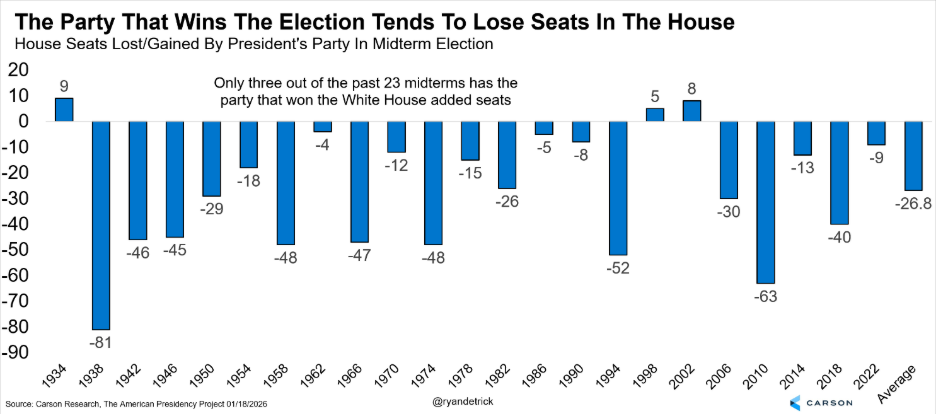
Here’s another chart that shows only three out of the past 23 midterms saw the party that won the White House add seats in the House in the midterm election. With one of the smallest House majorities in history, it isn’t too controversial to suggest the House flips to the Democrats.
Not About Red or Blue
As of now, the oddsmakers have the Democrats taking the House by a wide margin, but the Senate is a little bit closer, at about a 65% chance. Looking at history, a Republican president and Democratic Congress is one of the worst combinations for returns. A split Congress and Republican president is much better for returns.
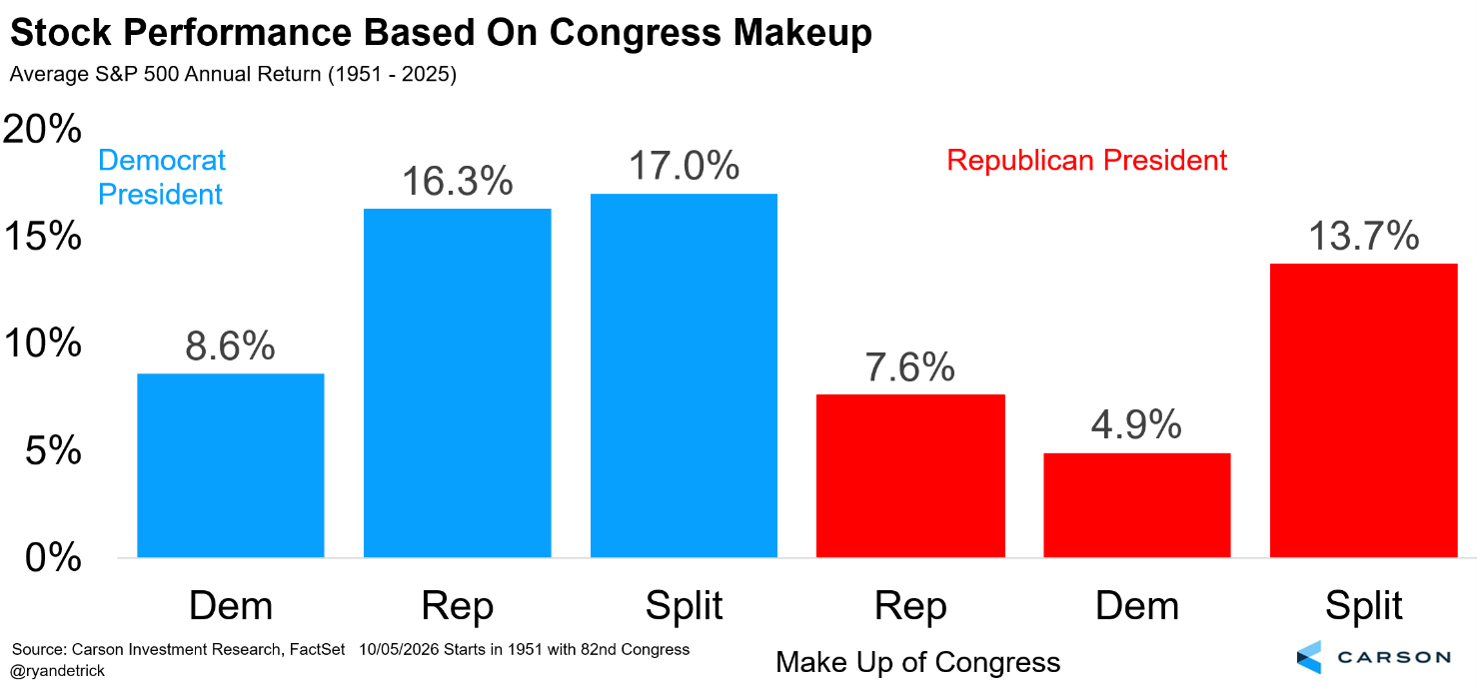
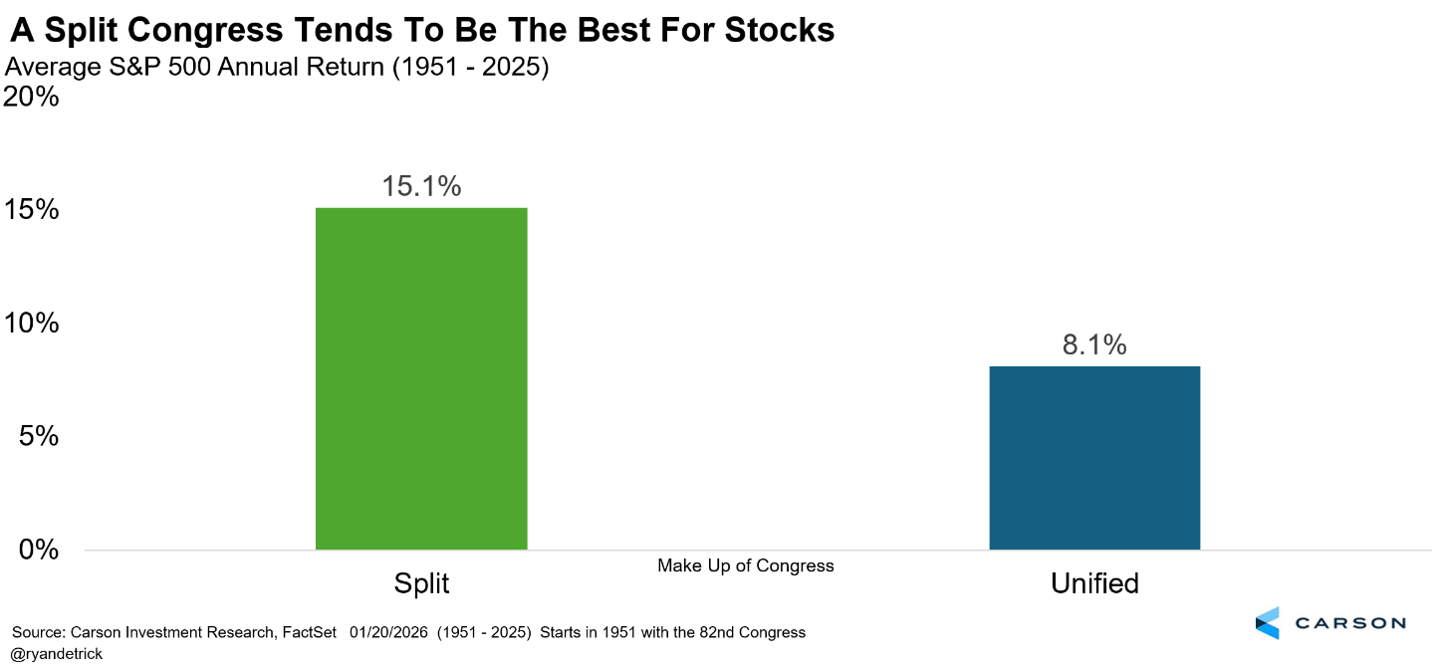
Here’s the thing: it isn’t about red, it isn’t about blue, it is about green. We broke it down by Congress, and it showed that a Democratic Congress is quite weak, a Republican-controlled Congress is a little bit better, but the best scenario for investors is a split Congress. Maybe the best Washington is one that needs to work together to get things done?
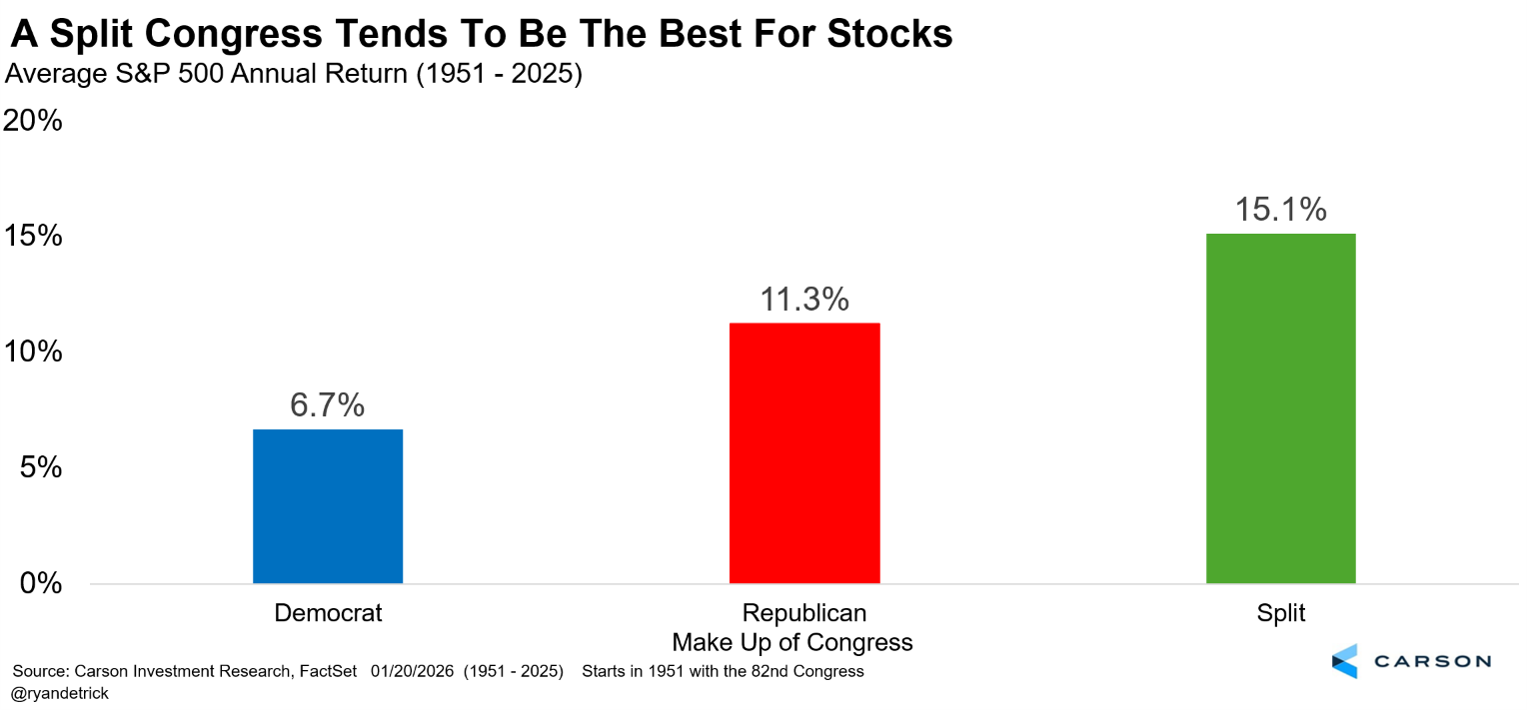
Here’s the same data, shown just based on a unified Congress versus a divided Congress. It’s yet another way of showing that a split Congress tends to be better for investors.
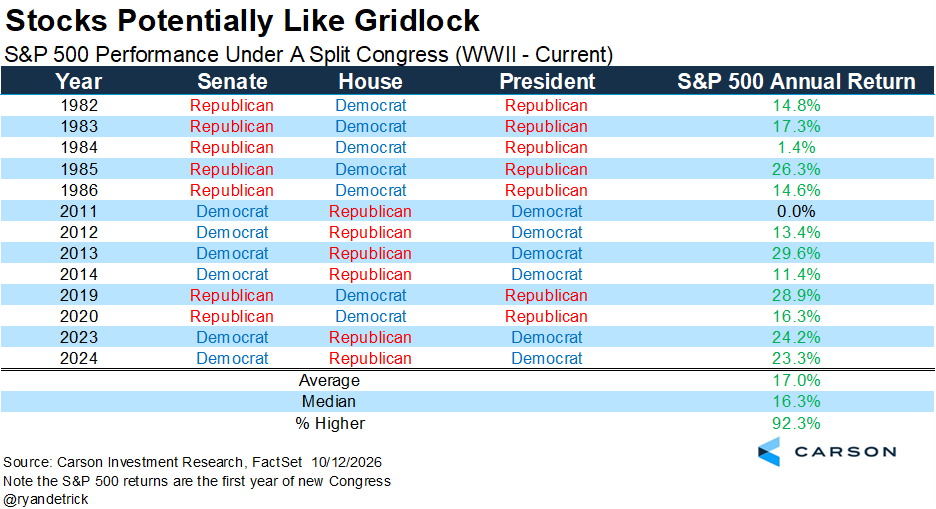
Lastly, the past 13 times we had a split Congress, the stock market never fell. Yes, 2011 was an exactly flat year, but the rest of those years were green, some by a nice margin. Gridlock can be a good thing. So the most likely configuration (Republican president, Democratic Congress) isn’t great right now, although the second most likely (Republican president, split Congress) is above average. But we wouldn’t take our bearings from this too strongly. It’s what’s happening in the economy that really matters, and we can’t imagine whether Congress is split or unified will make a meaningful difference.
Now What?
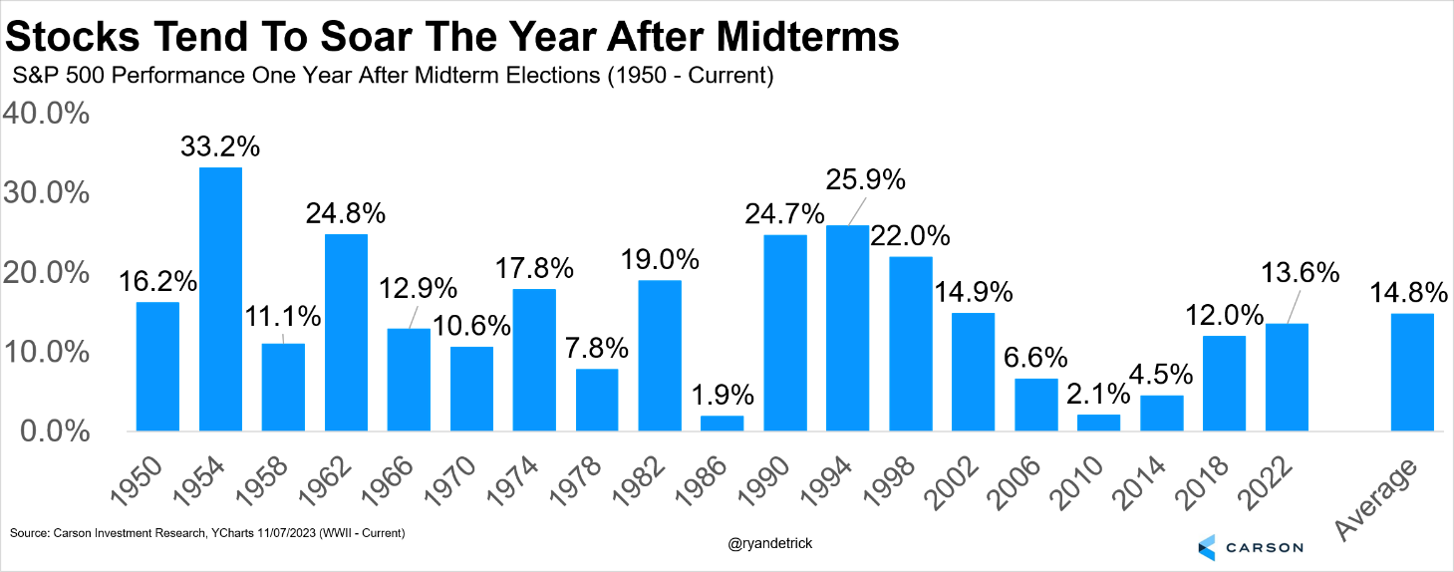
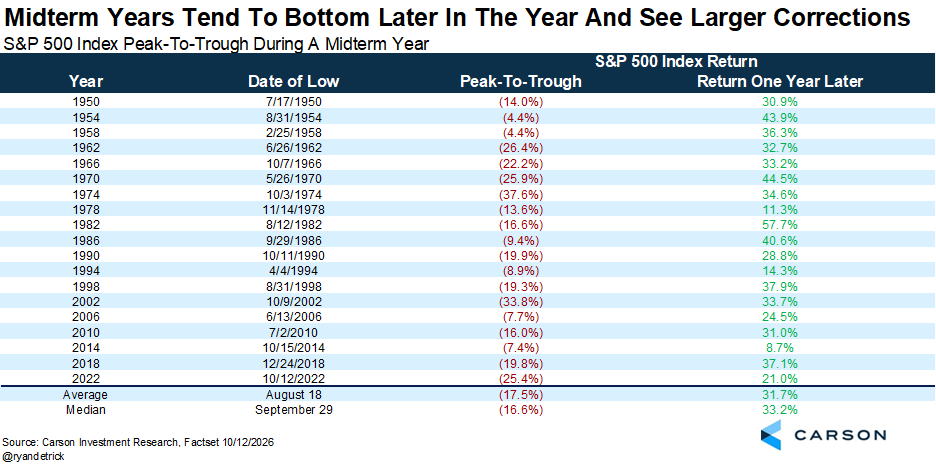
We can pontificate all day about midterms and what might happen, but the bottom line is the S&P 500 has been up a year after midterms the past 19 times, averaging close to 15%. That’s 19 times in a row! We don’t think that streak will end this time.
Earlier this year, the S&P 500 had a 9.1% mild correction that ended in late March. We’ve heard all year how bad midterms tend to be, but we were on record that that would be the largest pullback we’d see this year. That call wasn’t popular. In August and September many long-term bulls were cutting their forecasts and predicting bear markets, but we never did and held firm that the second half of 2026 would be a good one for investors.
Want some more good news? Historically, the S&P 500 is up nearly 32% off the midterm year max pullback, which in this case would be March 30. Stocks are up just over 18% since the late March lows, and history would suggest there could be more in the tank.
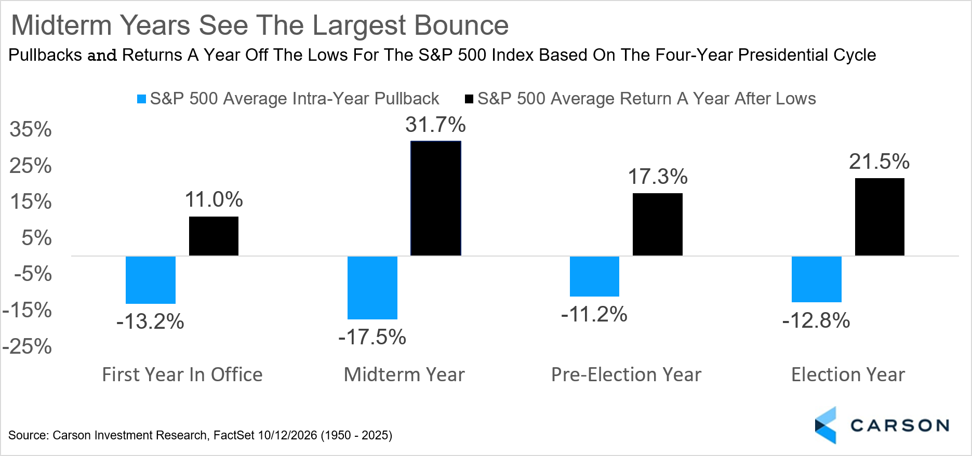
Here is that same data, broken down by all midterm years. Midterm years are the most volatile and tend to see the largest peak-to-trough correction out of the four-year cycle. The max drawdown tends to occur later in the year, but as we said back in May, the 9.1% mild correction we saw in February and March could be the max this year. While an unpopular call, it is now looking like it could be the right call, and the late March lows could be the earliest max peak-to-trough correction since 1954.
It’s All One Big Trade Now: AI or Bust
It’s easy to think of stocks, Treasuries, corporate bonds, commodities, and private markets as separate investments. But within a portfolio, they should be looked at as part of a whole, since developments in one corner of the market can quickly affect prices and expected returns elsewhere. Looking at asset classes in isolation risks missing the bigger picture. This is especially true now because they’re increasingly connected by one enormous force: the AI buildout. Even private equity and private credit (which were never truly independent “alternatives”) are going all in on the AI boom.
In other words, it’s all one big trade.
There’s been plenty of talk that AI capital spending is insensitive to interest rates. But last week’s market action suggested otherwise. Despite hot inflation data (more on that shortly), the 10-year Treasury yield plunged from 5.33% to 5.08% in a day. The explanation may lie in what happened to AI optimism. That’s a reminder that yields reflect more than inflation and Federal Reserve expectations. Investors are constantly reassessing competing opportunities for their capital.
Investors began questioning whether AI labs will generate sufficient revenue to justify their spending. One leading AI lab’s revenue grew 45% in the third quarter, which is impressive, but a marked slowdown from its 140% increase in the prior quarter. Meanwhile, the cost of insuring AI-related debt has jumped. Annual premiums to insure $10 million of debt using five-year credit default swaps (CDS) now stand at (via Bloomberg):
- An AI cloud provider: $1.1 million (10.87%, or 1087 basis points), up from $790,000 a month earlier (September 15)
- A large enterprise software and cloud company: $282,000 (282 basis points), up from $194,000 a month earlier
- A private AI-related aerospace company: $215,000 (215 basis points), up from $157,000 a month earlier
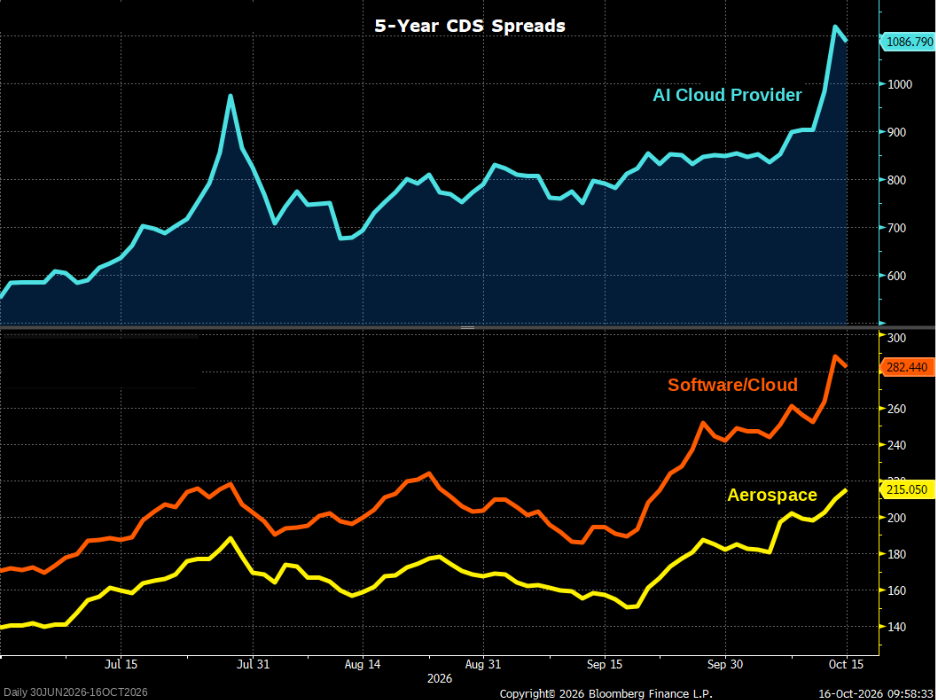
The widening spreads suggest lenders are becoming less comfortable with both the scale of the financing and the uncertainty around its payoff. Even megacap tech isn’t immune. One megacap tech company’s CDS cost rose to $106,000, from $55,000 at the start of the year. Another’s rose to $72,000, from $37,000 (Bloomberg).
What does this have to do with Treasuries? Consider a hypothetical example: a 5% bond yield looks unappealing if AI investments promise 25%-plus returns. But if those returns become uncertain, or turn negative, that same 5% suddenly looks attractive.
The implication is important: optimism about debt-financed AI infrastructure has itself helped push bond yields higher. When confidence wobbled, investors rushed back to Treasuries. The same optimism is also boosting nominal economic activity, which helps explain another seemingly contradictory development: inflation remaining stubbornly elevated even while some investors expect interest rates to fall. And it’s not just bond markets feeling the impact.
An Investment Supercycle Translates to Higher Inflation
A massive investment boom puts pressure on real resources and prices. It’s too convenient to blame inflation entirely on the Iran war and tariffs. The latest data suggest something broader, including bottlenecks created by AI spending.
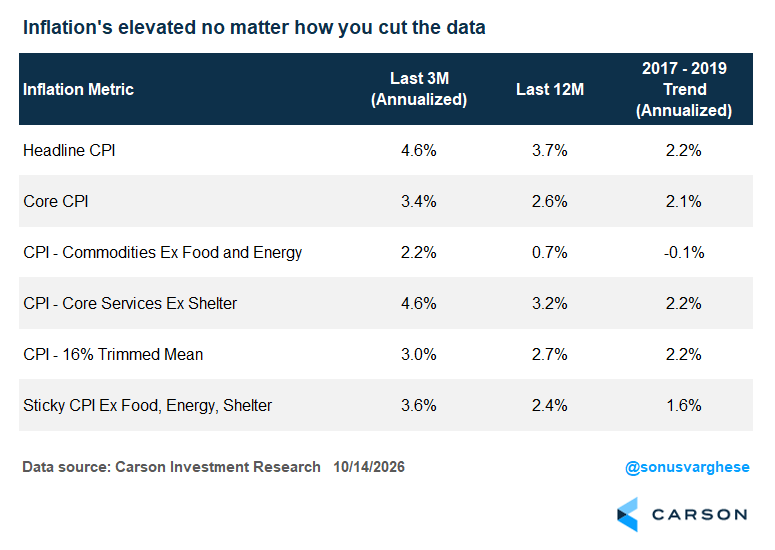
The headline Consumer Price Index (CPI) rose at an 8.1% annualized rate in September. Its three-month pace was 4.6%, with the 12-month rate at 3.7%. Energy matters, but inflation remains hot even when you strip it out. Over the past three months, annualized inflation ran at:
- 3.4% for core CPI (which excludes food and energy), versus 2.1% in 2017–2019
- 2.2% for core goods, versus -0.1% before the pandemic, a reversal partly reflecting tariffs and supply bottlenecks
- 4.6% for services excluding shelter, versus 2.2%, a particularly troubling sign of broad price pressure
- 3.0% for 16% Trimmed-Mean CPI, versus 2.2%. This metric excludes the 8% of CPI components with the highest and lowest one-month price changes from each tail of the price-change distribution
- 3.6% for Sticky CPI excluding food, energy, and shelter, versus 1.6%. This metric measures inflation for items whose prices typically don’t change frequently
There are only so many ways to say we have an inflation problem that goes well beyond an energy shock. And keep in mind that the Middle East conflict remains unresolved, which is why Brent crude prices are above $105 per barrel.
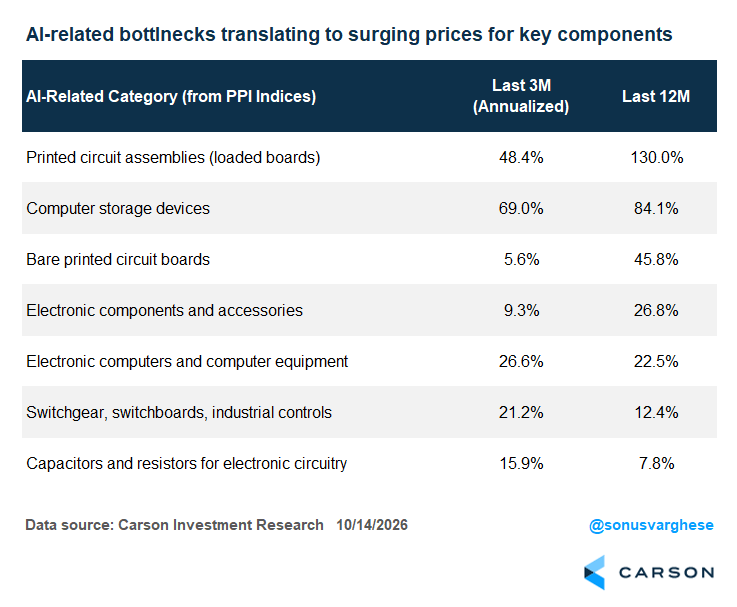
Producer prices tell the same story. The headline Producer Price Index (PPI) rose 6.4% over the past year, its fastest pace since late 2022. Even excluding food and energy, PPI climbed 5.0%, versus a 2.2% average in 2017–2019. Unlike the disinflationary technology boom of the late 1990s, today’s AI buildout is driving up input costs.
Look at some AI-linked components: printed circuit assemblies are up 130% over the past year; computer storage devices, 84%; bare printed circuit boards, 46%; and electronic components and accessories, 27%. These are not small price increases. They’re signs that demand is running into supply constraints. More spending doesn’t instantly create more electricity, chips, equipment, or manufacturing capacity. In the meantime, the businesses with scarce products or capacity gain pricing power.
Be Careful What You Wish For
Here’s the catch: sharply lower inflation could mean the AI buildout is losing momentum, particularly if prices fall because demand collapses rather than supply expands. For now, spending remains strong across businesses, consumers, and the government. Inflation is one consequence; expanding margins for energy producers and AI suppliers are another.
So if you’re hoping for much lower bond yields, cooler inflation, and broader stock market participation, consider what could get you there:
- An AI capex bust
- Rising unemployment, and/or
- Shrinking government deficits (ha, fat chance)
None would be particularly friendly to corporate profits. Lower inflation and lower yields are not automatically bullish for stocks if they arrive because the investment cycle and nominal growth are rolling over. That distinction is critical when so much of recent earnings growth is tied to one theme.
Profit Growth Has Become Remarkably Concentrated
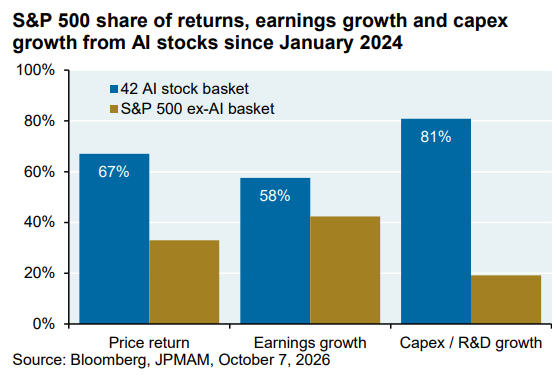
As J.P. Morgan’s Michael Cembalest recently illustrated, a basket of just 42 AI stocks accounted for roughly 67% of S&P 500 price returns, 58% of earnings growth, and 81% of capex and R&D growth since January 2024.
The beneficiaries are also concentrated within AI. Earnings for 55 AI supply-chain companies have quadrupled over about three and a half years, far outpacing companies adopting AI. It’s simple: one company’s capital spending is another company’s revenue and profits. Investors understandably focus on the firms selling the tools and infrastructure today. The eventual return on investment for the companies buying all this capacity is a different question.
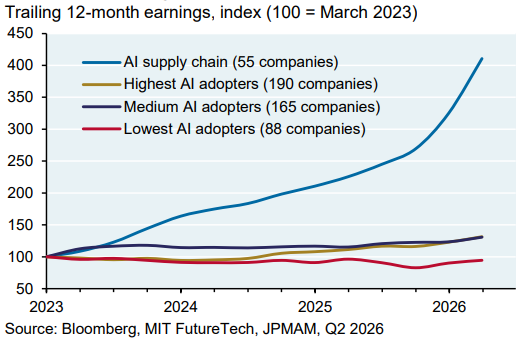
This is why an AI bust matters even if the resulting recession is relatively mild. Lower yields could revive interest-sensitive sectors such as housing, but the hit to profits and equities could still be substantial.
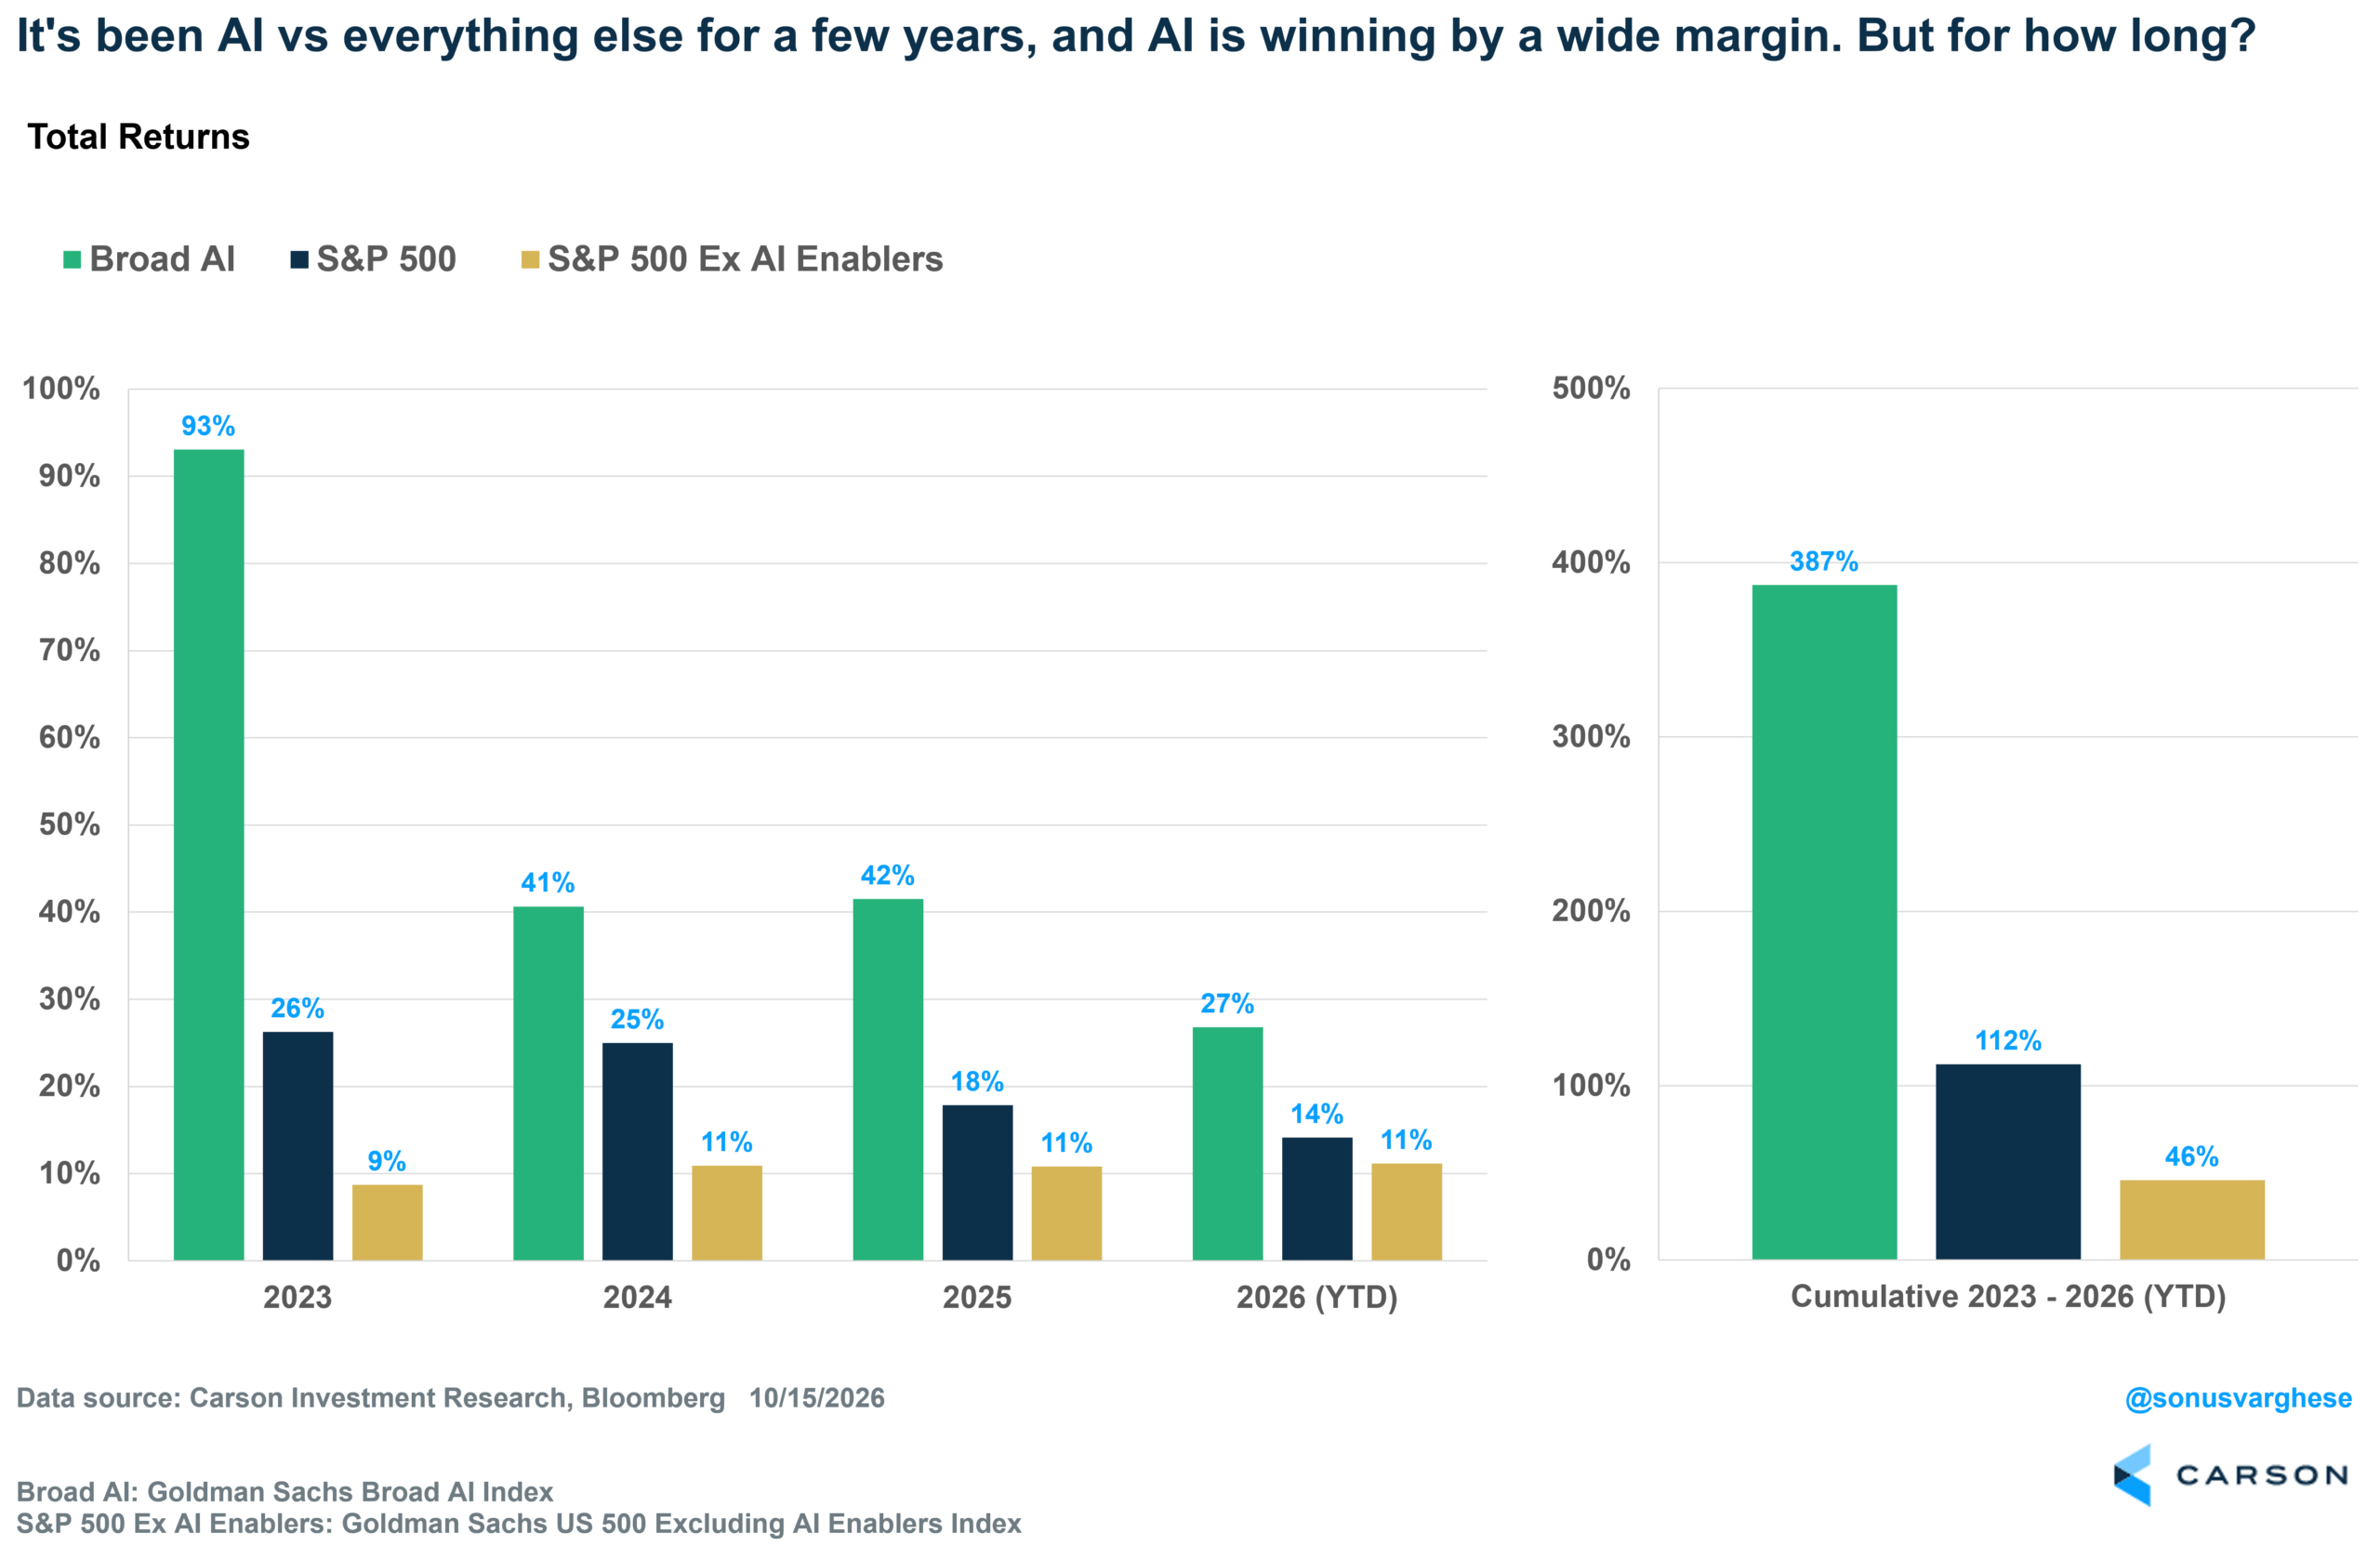
Since the end of 2022, a broad AI basket tracked by Goldman Sachs has returned 387%, or 51.8% annualized. It’s outperformed the broader index in every single year, including in 2026. The S&P 500 gained 112% (22% annualized), while the index excluding AI enablers returned 46% (10.4% annualized). That last figure is hardly terrible, but it shows just how much of the bull market depends on AI. A reversal would hurt a supposedly diversified S&P 500 whose weight in technology and technology-adjacent stocks exceeds 50%.
Ride the Wave, but Diversify
We’ll end where we did a few months ago, when we wrote about learning to stop worrying and love the bubble. We have no idea what stage of the bubble we are in, nor when it will pop. And we won’t pretend that we can perfectly time the top, and “get out in time, before everyone else.” Good luck with that.
Instead, as the AI wave gathers strength, we’re increasingly comfortable diversifying judiciously outside it, even at the cost of missing some spectacular gains. The goal is to ride the wave without getting wiped out on the other side. After all, if it really is one big trade, diversification matters more, not less.
S&P 500 — A capitalization-weighted index of 500 stocks designed to measure performance of the broad domestic economy through changes in the aggregate market value of 500 stocks representing all major industries.
The NASDAQ 100 Index is a stock index of the 100 largest companies by market capitalization traded on NASDAQ Stock Market. The NASDAQ 100 Index includes publicly traded companies from most sectors in the global economy, the major exception being financial services.
The views stated in this letter are not necessarily the opinion of Cetera Wealth Services LLC and should not be construed directly or indirectly as an offer to buy or sell any securities mentioned herein. Investors cannot invest directly in indexes. The performance of any index is not indicative of the performance of any investment and does not take into account the effects of inflation and the fees and expenses associated with investing.
A diversified portfolio does not assure a profit or protect against loss in a declining market.
All investing involves risk, including the possible loss of principal. There is no assurance that any investment strategy will be successful. This information is from sources believed to be reliable, but Cetera Wealth Services, LLC cannot guarantee or represent that it is accurate or complete.
9161464.1-1026-C
